SEARCH

McCloskey E. Assessing fracture risk in patients with osteoporosis. Practitioner 2013; 257 (1765):19-21
Assessing fracture risk in patients with osteoporosis
23 Oct 2013
AUTHORS
Professor Eugene McCloskey MD FRCPI
Professor of Adult Bone Disease, Academic Unit of Bone Metabolism, University of Sheffield, Sheffield, UK
Article
The management of osteoporosis is changing. Until recently, it largely centred on the use of diagnostic thresholds based on bone mineral density (BMD) measured at the spine or hip by dual x-ray absorptiometry (DXA).1
Thus, previous guidance was based on an opportunistic case-finding strategy whereby the presence of clinical risk factors would prompt clinicians to measure BMD. Those patients with a BMD value that fell within the range of osteoporosis, as defined by the World Health Organization, were considered for treatment.
More recently, it has been found that the presence of several of these risk factors is associated with a fracture risk greater than can be accounted for by BMD alone.2,3 Assessment of fracture risk therefore needs to take into account specific risk factors that contribute to fracture risk as well as BMD, since this will increase the detection rate of individuals who are at high risk of sustaining an osteoporotic fracture.
This approach has been endorsed by NICE with the publication of a clinical guideline on assessing the risk of fragility fracture in August 2012.4 This guideline recognises that there are effective agents for the primary or secondary prevention of fragility fractures and that a number of risk assessment tools are available to predict fracture incidence over a period of time.
Risk assessment
Key recommendations on risk assessment from the NICE guideline are summarised in table 1.
The guideline states that two tools, FRAX5 (www.shef.ac.uk/FRAX) and QFracture6,7(www.qfracture.org), are available for use. However, there are important differences between the two tools.
Fracture risk
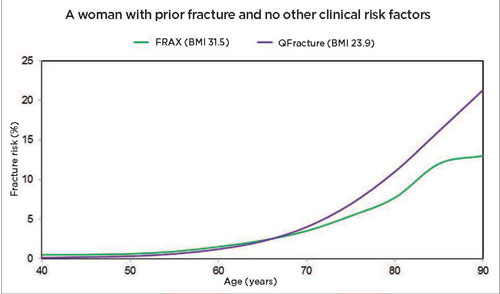
It is important to note that the term fracture risk can be expressed by different metrics. In the case of FRAX, the algorithm computes a fracture probability (i.e. a metric that incorporates the competing risk of death) and this is not synonymous with cumulative fracture incidence as estimated by QFracture, see figure 1.
The calculation of cumulative incidence ignores the fracture status of those that do not survive, and the fracture and death status of those lost to follow-up. By and large, such fracture incidences will continue to rise inexorably with age, see figure 1.
In contrast, as the risk of mortality increases at older ages, the fracture probability calculated with FRAX does not follow the same pattern.
The probability levels off and even decreases at extreme old age as the risk of mortality exceeds the risk of fracture, see figure 1.
Even if both tools were measuring the same fracture risk, there would be an inherent discordance between the two tools at older ages with FRAX giving lower values.
Absolute fracture risk
Figure 1 also shows that FRAX and QFracture do not give the same estimates of absolute risk. The risks at age 65 were made equal in the two tools but this required a fairly marked difference in BMI between otherwise similar patient examples.
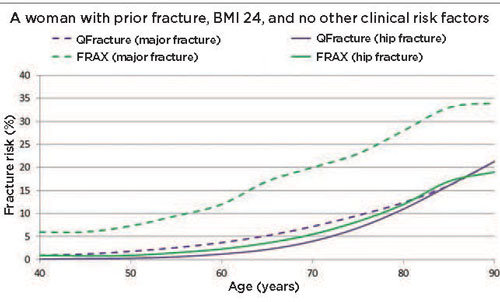
The difference between absolute risk estimates from the two tools is even more marked when such adjustments are not made, see figure 2. In the example shown, a woman with a BMI of 24 with a prior fracture has a much higher risk of major osteoporotic fracture with FRAX than with QFracture. There is a several-fold difference at younger ages and even at older ages the FRAX estimates are two-fold higher than QFracture, see figure 2, below.
While the differences between hip fracture risks appear less marked, there is still a two-fold difference in estimates. The reasons lie in the different calibrations used in the two models. In the UK model of FRAX, as in all the other models of FRAX, the risk algorithm is superimposed on, or calibrated to, the epidemiology of fracture (and mortality) incidence in the UK.5
In contrast, the QFracture output reflects the incidence of fracture contained within the primary care database used to derive the tool. Whatever the reasons for these differences, it is clear that outputs of absolute risk from the two tools are not interchangeable. This has an obvious knock-on effect on the interpretation of the output numbers, particularly in relation to assessment and intervention thresholds.
Assessment and intervention thresholds
The successful implementation of a risk prediction tool requires advice to be provided about how to handle the outputs from the calculations.
In the setting of osteoporosis, this advice needs to address assessment thresholds (to direct further assessment with BMD) and intervention thresholds (to direct therapeutic intervention).
NICE approves this approach by stating in the guideline that the measurement of BMD by DXA should be considered in people whose fracture risk is in the region of an intervention threshold following risk assessment with FRAX (without a BMD value) or QFracture. However, it does not then define the assessment or intervention thresholds as this was deemed outside the scope of the guideline.
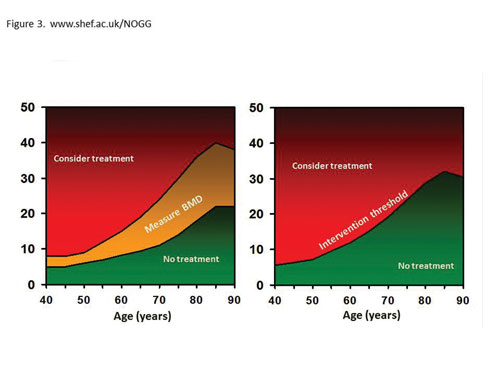
It is clear that given the differences in outputs from the two tools that separate thresholds will be needed for FRAX and QFracture. The National Osteoporosis Guideline Group (NOGG) produced these thresholds for FRAX shortly after the launch of FRAX in the UK in 2008, see figure 3.8 Early evaluation of these thresholds suggests a close concordance between physician decisions made before the availability of FRAX and NOGG thresholds and those arrived at by following the NOGG thresholds.9
BMD measurement contributes an additional, independent risk factor for better characterisation of fracture risk in the individual patient and there is a need to be able to integrate the BMD result with the other risk factors.
As BMD is not an entry variable for QFracture, NICE recommends the recalculation of absolute risk using FRAX once the BMD value is known.
Conclusion
The recognition by NICE that assessment of absolute fracture risk should direct osteoporosis management in the UK is a welcome development.
NICE has advocated the use of FRAX or QFracture in the assessment of fracture risk and it is important to appreciate that these tools are not interchangeable.
Clinical utility requires assessment thresholds, intervention thresholds and integration of BMD. The FRAX/NOGG approach addresses these requirements. Targeting scans to those at or near the intervention threshold is an efficient use of resources.
REFERENCES
1 Royal College of Physicians, Osteoporosis: clinical guidelines for the prevention and treatment. RCP. London. 1999
2 Johansson H, Kanis JA, Oden A et al. BMD, clinical risk factors and their combination for hip fracture prevention. Osteoporos Int 2009;20(10):1675-82
3 Kanis JA, Johansson H, Oden A et al. Assessment of fracture risk. Eur J Radiol 2009;71(3):392-7
4 National Institute for Health and Clinical Excellence. CG146. Osteoporosis:assessing the risk of fragility fracture. NICE. London. 2012
5 Kanis JA, Johnell O, Oden A et al. FRAX and the assessment of fracture probability in men and women from the UK. Osteoporos Int 2008;19(4):385-97
6 Hippisley-Cox J and Coupland C. Predicting risk of osteoporotic fracture in men and women in England and Wales: prospective derivation and validation of QFractureScores. BMJ 2009;339:b4229
7 Hippisley-Cox J and Coupland C. Derivation and validation of updated QFracture algorithm to predict risk of osteoporotic fracture in primary care in the United Kingdom: prospective open cohort study.
BMJ 2012;344:e3427
8 Compston J, Cooper A, Cooper C et al. Guidelines for the diagnosis and management of osteoporosis in postmenopausal women and men from the age of 50 years in the UK. Maturitas 2009;62(2):105-8
9 Crabtree NJ, Bebbington NA, Chapman DM et al. Impact of UK National Guidelines based on FRAX(R) —comparison with current clinical practice. Clin Endocrinol (Oxf) 2010;73(4):452-6
ARTICLE IN PDF
 Download this article in PDF format
CLICK ON IMAGES
PRESET SEARCHES
Immediate CPD prompts
These handy templates* prompt immediate drafting of personal learning, reflection and planning. Save your record straight into your personal development folder on your device or Cloud storage system.
*Adobe reader needed for iPad
EXTERNAL WEBLINKS
QFracture
www.qfracture.org
NICE Evidence
PubMed